
Previously from this Series:
Intro – How it all Started
Part 1 – Using Your EOBs
Part 2 – Breakeven Point & Worst Case Scenarios
Now that you have collected and listed your EOBs, you can now begin to analyze you medical expenses and start comparing plans for next year.
Before we dive headfirst into the breakeven point, if you have all the information for a previous year, I recommend you apply next year’s plan information to last year’s medical expenses to see how a real life comparison would look like. To do that you will need the totals for the co-pay and co-insurance from the list you have put together as well as certain insurance plan information. Here is a list of the information you will need: total charges submitted, total network savings, total co-pay, total co-insurance, plan 1 price tag, plan 1 deductibles, plan 1 co-insurance percentage and the corresponding plan information for plan 2.
If you have totaled up the amounts for charges submitted and network savings from your EOBs, then you can apply the deductible, then the co-insurance for each plan you want to compare and the add up how much you would have been responsible for under each plan. Then if you know how much you paid in co-pays (for this case assume co-pays amount to be the same for each plan) and you know the annual price tag for each plan you now have all the information you need to compare the plans.
Add up (for each plan) the deductible, the amount you would pay based on the amount of the co-insurance, and the annual price tag for the plan and that is your total cost.
Here is an example using the information from the previous article Using Your EOBs that you can follow along with: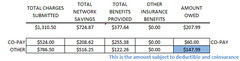 Image by FFL-LRG via Flickr
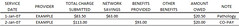
From the summary of the EOB:
- Total Co-pay = $60.00
- Total Charges Submitted = $786.50
- Total Network Savings = $516.25
- Total Benefits Provided = $122.26
- Total Charges Subject to Co-insurance = $786.50 - $516.25 - $122.26 = $147.99 (after meeting deductible)
Now use th
e medical expense history along with the information for the 2 plans you want to compare. For the sake of simplicity, I kept the co-pay amount the same for both plans in my comparison.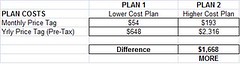 Image by FFL-LRG via Flickr
My example:
Plan 1
Annual Price Tag = $648
Deductible = $500 / $1,250 (individual / family)
Co-insurance = 20% (amount you pay)
Plan 2
Annual Price Tag = $2,316
Deductible = $200 / $500 (individual / family)
Co-insurance = 10% (amount you pay)
Because the amount subject to insurance, $147.99 is less than the deductible under both plans, the total cost will be $147.99 plus the annual price tag for the plan.
In this case:
Plan 1 = $147.99 + $648 = $795.99
Plan 2 = $147.99 + $2,316 = $2,463.99
Save $1,668 with Plan 1!
So you ask, what if I have a lot more medical expenses than your example?
Ok, so let’s look at the worst case scenario. To do this you will need to know the out-of-pocket (OOP) maximum for each plan. For my example let use $4,000 for Plan 1 and $2,000 for Plan 2. For this example let’s assume that the plan covers 100% after you meet you OOP Max.
My example:
Plan 1 = $4,000 + $648 = $4,648
Plan 2 = $2,000 + $2,316 = $4,316
Save only $332 with Plan 2!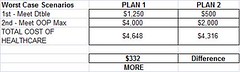 Image by FFL-LRG via Flickr
So now let’s go back to the EOB details we looked at before. For that example, the total charges submitted to insurance (not subject to co-pay) was $786.50, but due to network savings and benefits provided, that was reduced to $147.99. Looking at the two plans from my example, what would the breakeven point be for total medical expenses submitted to insurance (minus network savings) need to be in order for the more costly, lower deductible plan to actually be worth it?
Well this looks a little busy or complicated but it’s really not. First we must define some things to make the formula much shorter.
Plan 1 Co-Insurance = A1
Plan 1 Deductible = B1
Plan 1 Price Tag = C1
Plan 2 Co-Insurance = A2
Plan 2 Deductible = B2
Plan 2 Price Tag = C2
BREAKEVEN = [(-A2*B2+B2+C2)-(-A1*B1+B1+C1)] / (A1-A2)
For my example BREAKEVEN = $11,180
Below is a graph showing the medical expenses and what each plan covers plus a screen shot of the data I used to generate the graph.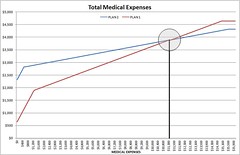 Image by FFL-LRG via Flickr
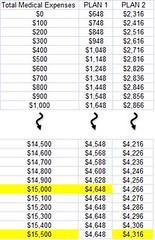 Image by FFL-LRG via Flickr
Stay tuned, the next post will have screenshots and include the spreadsheet I put together that you can use to compare different healthcare benefit plans, including TAX implications of pre-tax dollars used to pay for health insurance.
![Reblog this post [with Zemanta]](http://img.zemanta.com/reblog_c.png?x-id=674a0829-103f-48d9-9944-e252bd6f5cac)

![Reblog this post [with Zemanta]](http://img.zemanta.com/reblog_c.png?x-id=9492f540-5916-430d-949e-ce6f526bddb3)

![Reblog this post [with Zemanta]](http://img.zemanta.com/reblog_c.png?x-id=2899ae5b-3bac-45f7-815d-11eb9ae5327c)

![Reblog this post [with Zemanta]](http://img.zemanta.com/reblog_c.png?x-id=6446636f-7557-4847-9731-49578278f6cd)
![Reblog this post [with Zemanta]](http://img.zemanta.com/reblog_c.png?x-id=01148460-6597-492e-af9a-5340251709a0)
![Reblog this post [with Zemanta]](http://img.zemanta.com/reblog_c.png?x-id=a00f5f2a-e80a-4a70-8cdf-679a79e9d856)


![Reblog this post [with Zemanta]](http://img.zemanta.com/reblog_c.png?x-id=61b71241-fc6c-4834-8d20-81988bd2a5a8)


